Who are graphic communication, website and information designers designing for and communicating with?

This is a freely reusable and copyright free infographic that accompanies the article called Information on different categories of people for graphic communication, website and information designers, published on https://medium.com/@user_design, October 2021.

▼ Age

Children, 4–12 years old

Black line pictogram of 2 people. On the left is a female child. On the right, is a male child

9% (534 million people) 1 in 11 people worldwide are children aged 5⁠–⁠9 years old (World Health Organisation, 2001)

Single black bar graph showing 0% at the bottom and 100% at the top. The bar graph value is 9%

Teenagers, 13–19 years old

Black line pictogram of 2 people. On the left is a female teenager. On the right, is a male teenager

8% (596 million people) 1 in 13 people worldwide are aged between 15–19 years old (United Nations, 2017)

Single black bar graph showing 0% at the bottom and 100% at the top. The bar graph value is 8%

General people, 20–45 years old

Black line pictogram of 2 people. On the left is a young-middle aged woman. On the right, is an young-middle aged man

37% (2.7 billion people) 1 in 3 people worldwide are aged between 25–44 years old (United Nations, 2017)

Single black bar graph showing 0% at the bottom and 100% at the top. The bar graph value is 37%

Middle aged adults, 45–59 years old

Black line pictogram of 2 people. On the left is a middle aged woman. On the right, is an middle aged man

17% (1.2 billion people) 1 in 6 people worldwide are aged between 45–59 years old (United Nations, 2017)

Single black bar graph showing 0% at the bottom and 100% at the top. The bar graph value is 17%

Older adults, 60+ years old

Black line pictogram of 2 people. On the left is an older aged woman with a walking stick. On the right, is an older aged man, holding her hand

13% (962 million people) 1 in 8 people worldwide are aged 60+ years old (United Nations, 2017)

Single black bar graph showing 0% at the bottom and 100% at the top. The bar graph value is 13%

▼ Conditions

Dyslexia

Black line pictogram of a person reading a book with 'ABC' and '123' written on the front cover. A speech bubble also comes from the top of the persons head with 'Dyslexia' written within it

10% (528 million people) 1 in 10 people worldwide show some signs of dyslexia (Pennington, 1991)

Single black bar graph showing 0% at the bottom and 100% at the top. The bar graph value is 10%

Aphasia

Black line pictogram of a person reading a book with 'ABC' and '123' written on the front cover. A speech bubble also comes from the top of the persons head with 'Dyslexia' written within it

0.06% (5.7 million) people worldwide can have aphasia. 38% of stroke survivors get aphasia. (Australian Aphasia Rehabilitation Pathway, 2020).

Single black bar graph showing 0% at the bottom and 100% at the top. The bar graph value is 25%

Vision impairment

Black line pictogram of a person walking forwards with an arm out the the waist holding a stick which people with vision impairments use

3% (253 million people) 1 in 33 people worldwide have a vision impairment (World Health Organization, 2017)

Single black bar graph showing 0% at the bottom and 100% at the top. The bar graph value is 3%

Colour blindness

Black line pictogram of one eye, with half the eye filled with diagonal lines

8% (1 in 12 men) and 0.5% (1 in 200 women) worldwide have colour blindness (Colour Blind Awareness, 2016)

Double black bar graph showing 0% at the bottom and 100% at the top. The bar graph values are: left male 8%, and right women 0.5%

Arthritis

Black line pictogram of a person holding their right shoulder and pain/warning lines coming out of it

25% (1 in 4 adults) of people in the usa and Europe, have some form of arthritis (Barbour, 2017; eular, 2017)

Single black bar graph showing 0% at the bottom and 100% at the top. The bar graph value is 25%

▼ Literacy

Text and numerical illiteracy

Black line pictogram of a person reading a book with 'ABC' and '123' written on the front cover

15% of people who are aged 15+ worldwide are illiterate (unesco, 2015)

Single black bar graph showing 0% at the bottom and 100% at the top. The bar graph value is 15%

Digital illiteracy

Black line pictogram of a person sitting at a desk, using a computer

25% (12 million adults) 1 in 4 people in the uk, cannot complete 5 basic online tasks (Arnett, 2015)

Single black bar graph showing 0% at the bottom and 100% at the top. The bar graph value is 25%

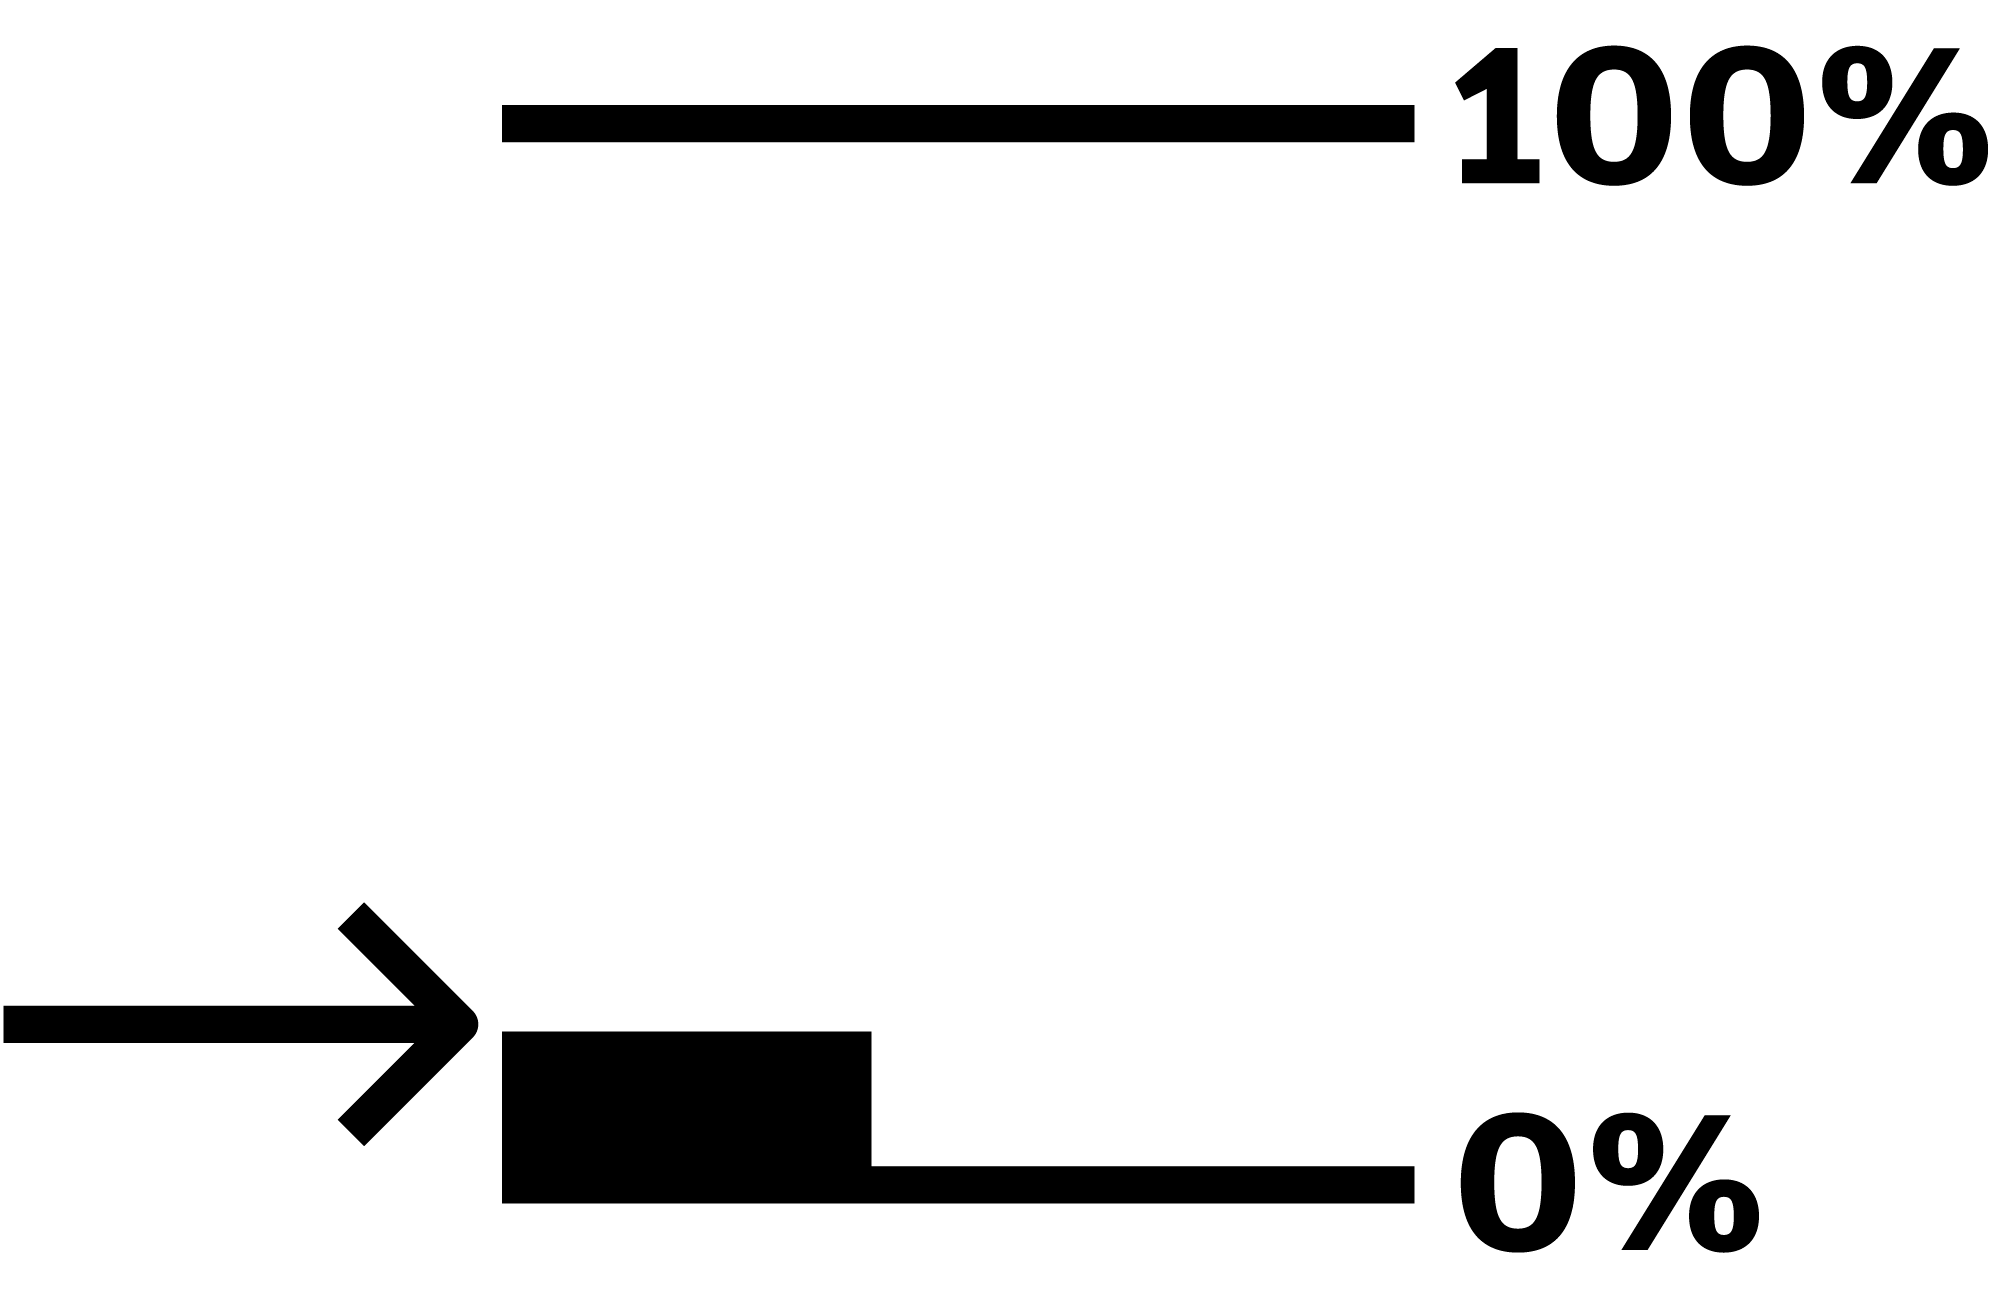
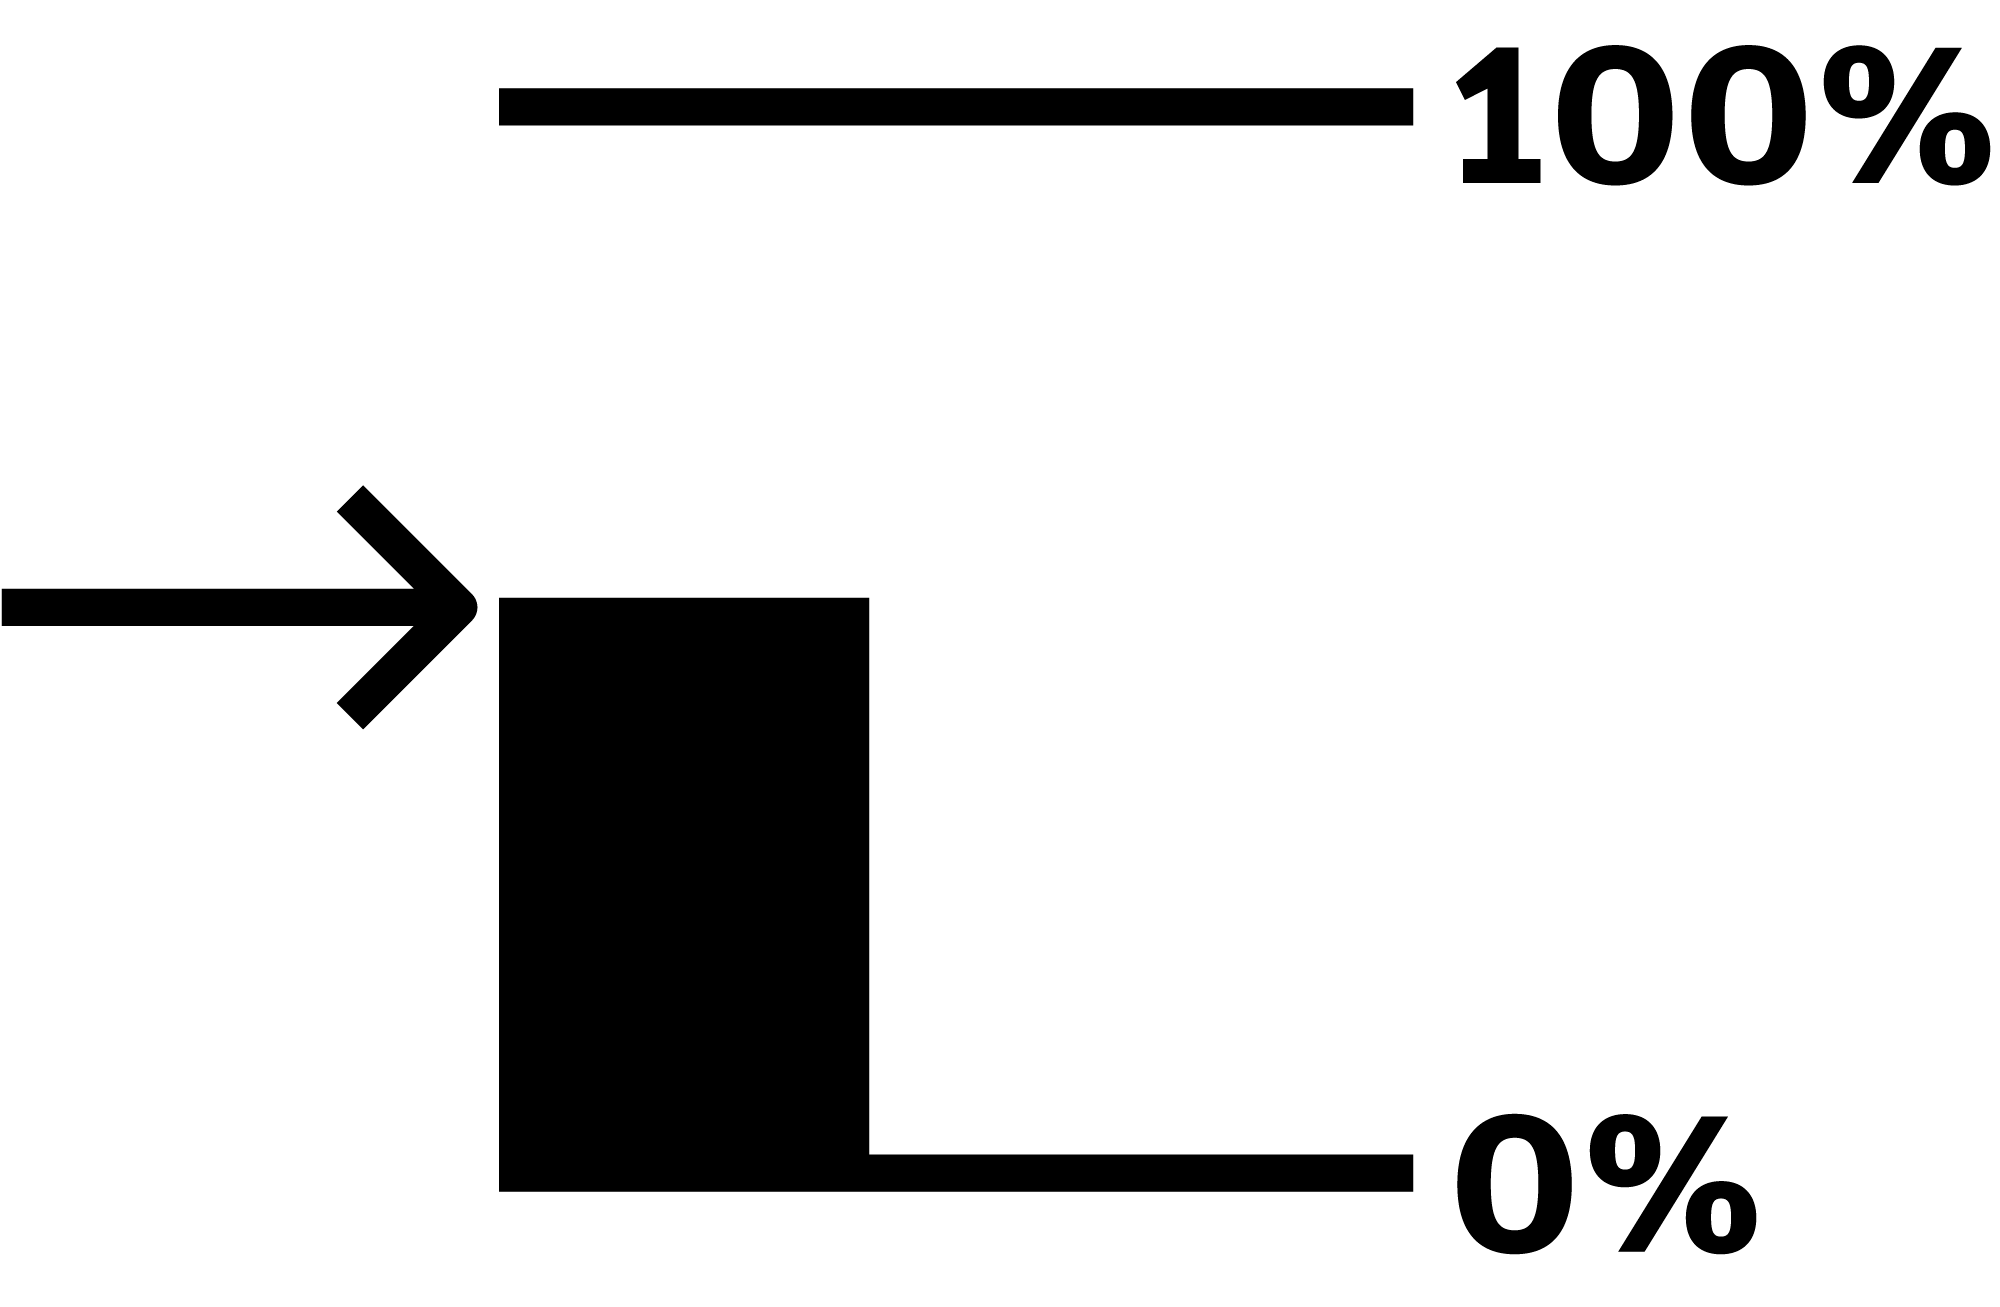
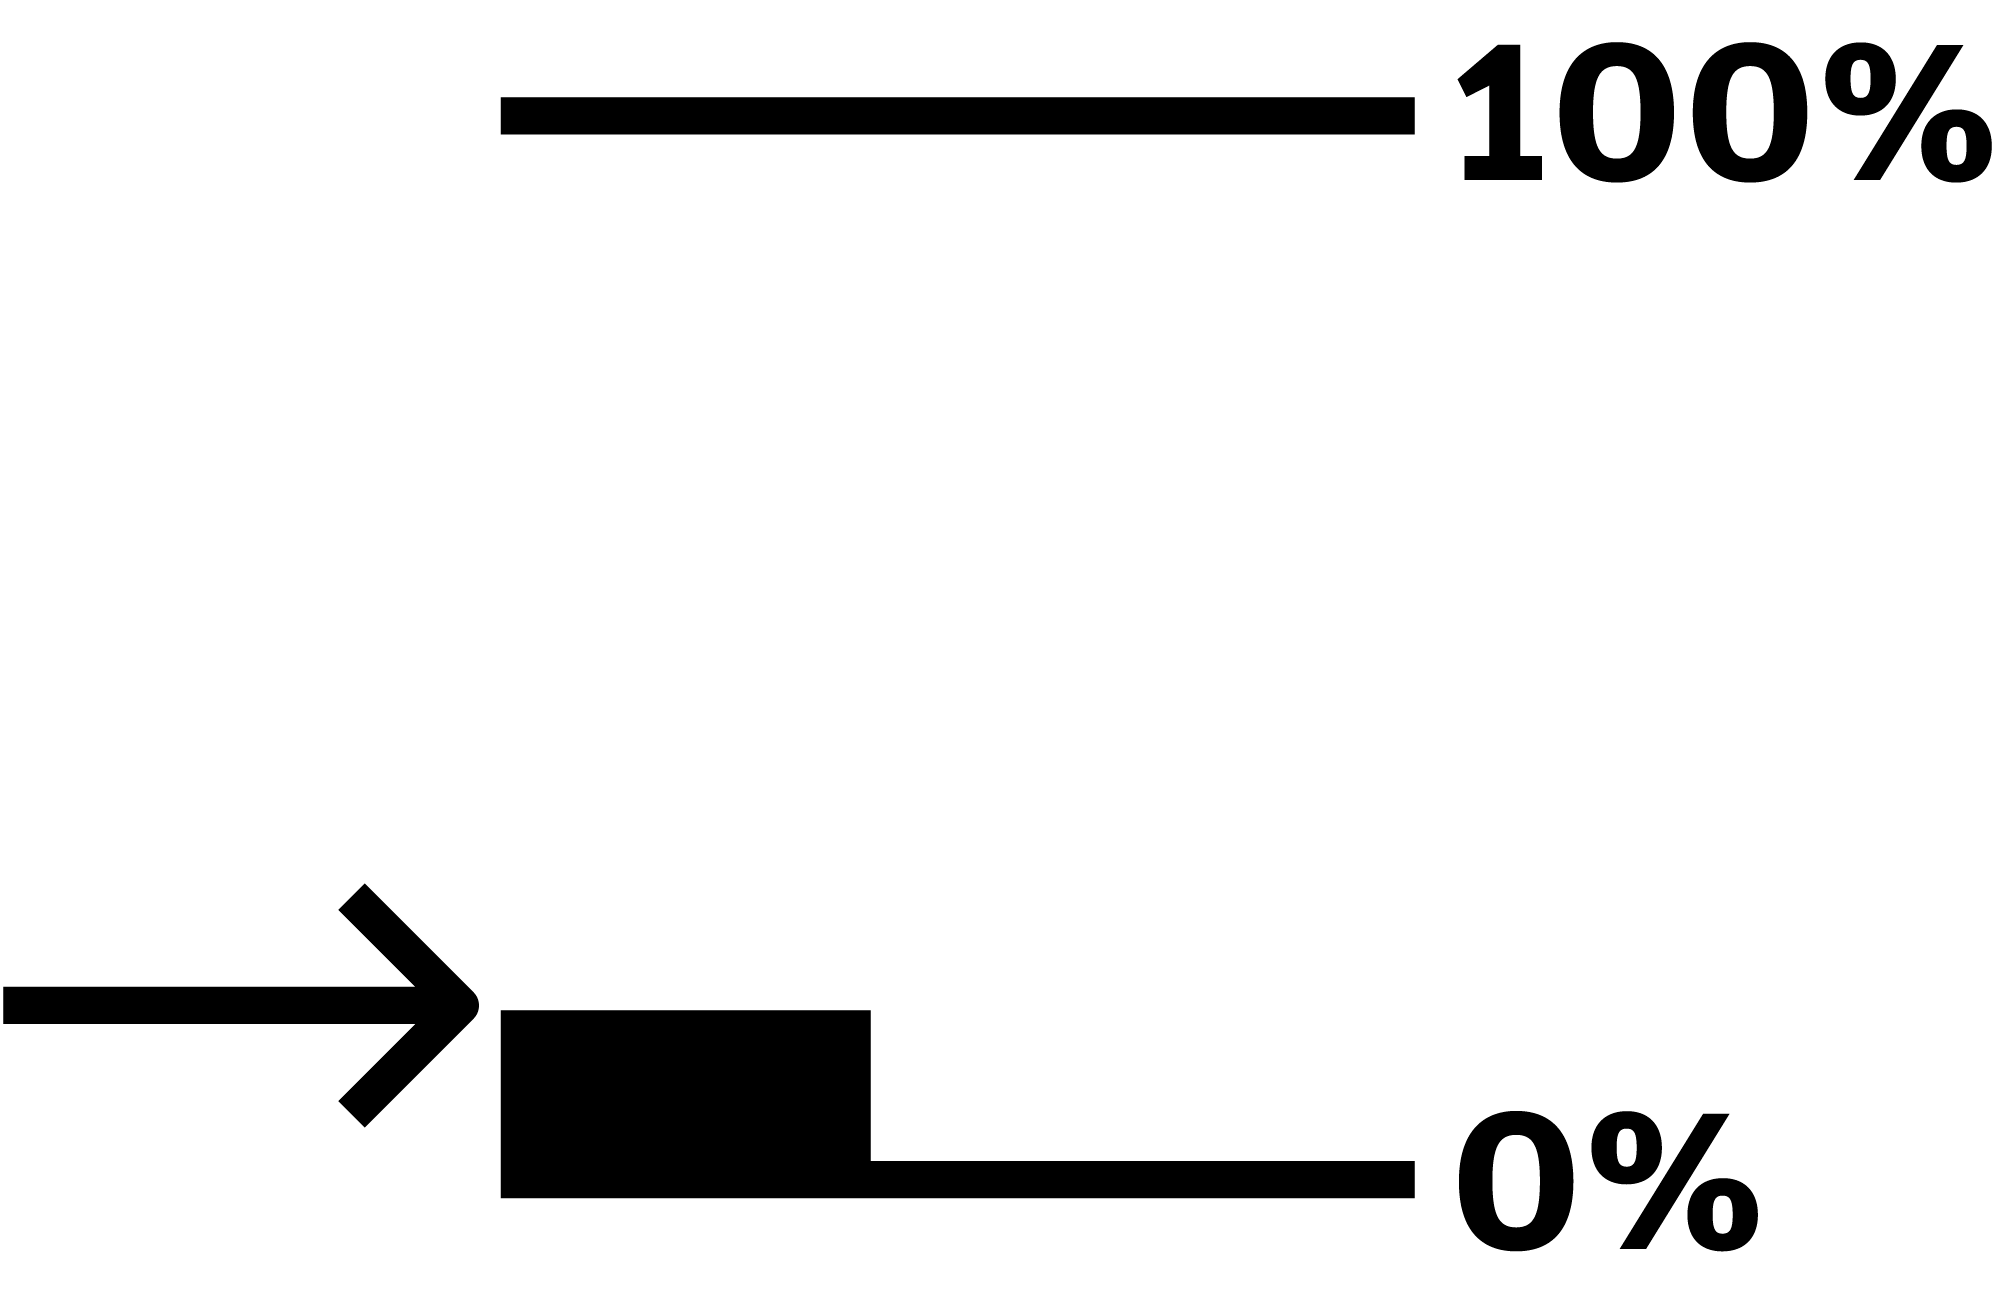
Total percent overview

Children, 4–12 years old
(worldwide)

Horizontal bar chart showing a thick black line, then 9% to the right of it

Teenagers, 13–19 years old (worldwide)

Horizontal bar chart showing a thick black line, then 8% to the right of it

General people, 20–45 years old (worldwide)

Horizontal bar chart showing a thick black line, then 37% to the right of it

Middle aged adults, 45–59 years old (worldwide)

Horizontal bar chart showing a thick black line, then 17% to the right of it

Older adults, 60+ years old (worldwide)

Horizontal bar chart showing a thick black line, then 13% to the right of it

Dyslexia (worldwide)

Horizontal bar chart showing a thick black line, then 10% to the right of it

Aphasia (worldwide)

Horizontal bar chart showing a thick black line, then 0.06% to the right of it

Vision impairment (worldwide)

Horizontal bar chart showing a thick black line, then 3% to the right of it

Colour blindness (worldwide)

Horizontal bar chart showing a thick black line, then 8% to the right of it

Arthritis (usa and Europe)

Horizontal bar chart showing a thick black line, then 25% to the right of it

Text and numerical literacy (worldwide)

Horizontal bar chart showing a thick black line, then 15% to the right of it

Digital literacy (uk)

Horizontal bar chart showing a thick black line, then 25% to the right of it

The x axis at the bottom of the horizomtal bar chart, showing from left to right: 0%, 20%, 40%, 60%, 80%, and 100%

You can freely reuse this infographic, it is copyright free. Do not edit or modify it though. Please always credit us when using it: Infographic by User Design, Illustration and Typesetting, www.userdesignillustrationandtypesetting.com, from the article called Information on different categories of people for graphic communication, website and information designers published on https://medium.com/@user_design. Infographic version: October 2021.